SysInternal Process Explorer with SQL Server
Another SysInternals (www.sysinternals.com) tool I use quite a bit is the Process Explorer, which has just had a new release, taking it to V. 15.3. Process Explorer allows you to correlate CPU thread activity with the SQL Server threads. I find this a very quick and easy way to go from CPU utilisation into SQL and identify the query which is burning CPU. Now, this technique is not new – in fact the guys at SQLSkills (www.sqlskills.com) have blogged about this far better than I can – but…. I use this in anger, and it hasn’t let me down yet. Consequently, I find this a VERY useful tool in my troubleshooting kit bag.
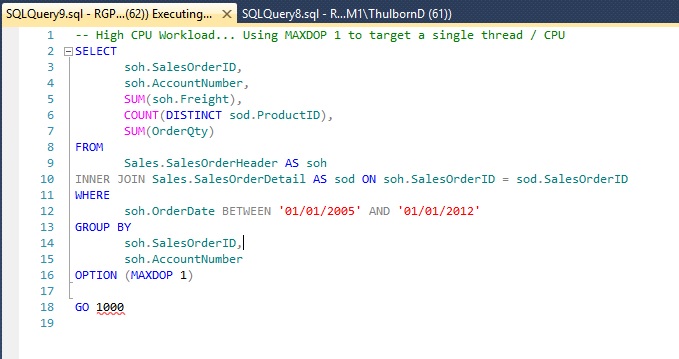
e.g…. First I create an AdventureWorks workload which hammers a single CPU due to the MAXDOP 1 setting on the query.
Now, with the “problem” at hand, I can open up Process Explorer and sort by CPU usage.
This can very quickly show me the SQL Server process is responsible for using CPU resources (which is the intention), but then right clicking on the SQL Server process and selecting “Properties” will give you a window such as this:
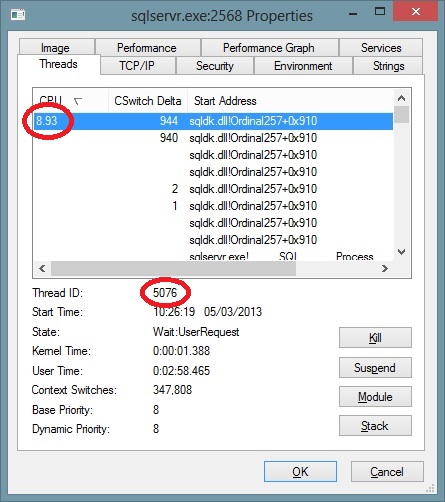
The threads tab shows you the Operating System level threads which are running within the SQL Server process, complete with the ability to sort by thread utilisation and the Thread Id which is actually running the user query.
Armed with this information, we can query SQL Server itself using:
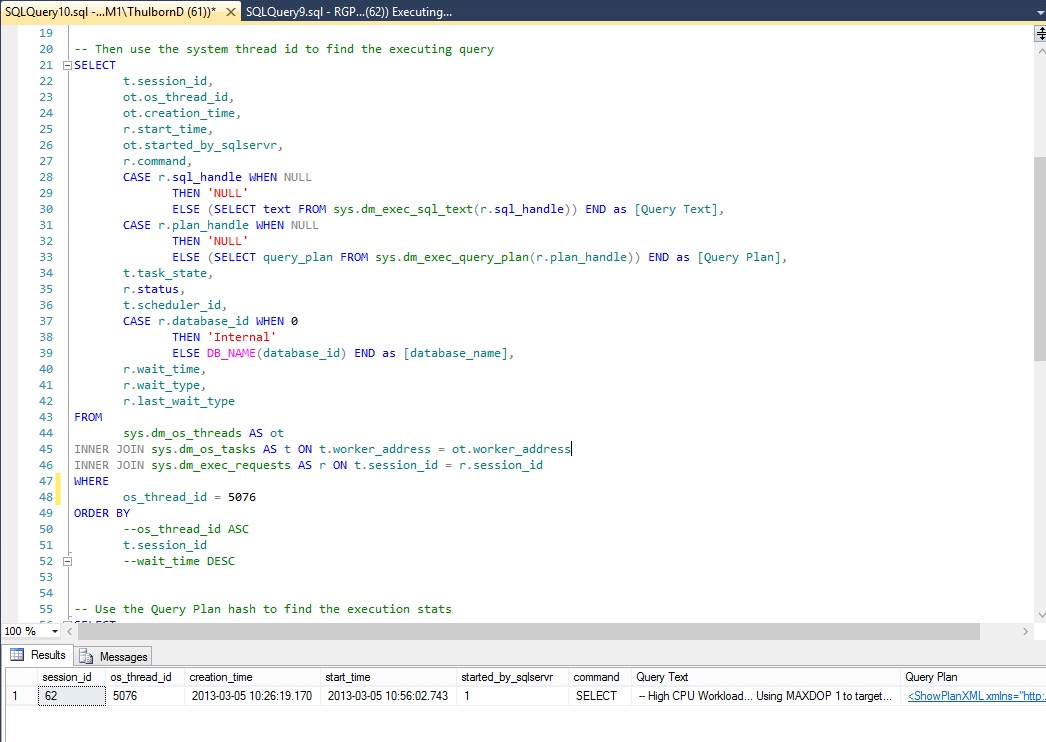
To see all the details of the query which is causing the CPU load. These details can expose everything about the query, from the actual statement, the plan, the connection details – all the usual goodness from the SQL Server DMVs. With the Process Explorer tool and SQL Server coupled in such a way, finding the full details about a hard hitting query takes less than a minute. Happy Days!..

Recent Comments