SysInternal Process Explorer with SQL Server
Another SysInternals (www.sysinternals.com) tool I use quite a bit is the Process Explorer, which has just had a new release, taking it to V. 15.3. Process Explorer allows you to correlate CPU thread activity with the SQL Server threads. I find this a very quick and easy way to go from CPU utilisation into SQL and identify the query which is burning CPU. Now, this technique is not new – in fact the guys at SQLSkills (www.sqlskills.com) have blogged about this far better than I can – but…. I use this in anger, and it hasn’t let me down yet. Consequently, I find this a VERY useful tool in my troubleshooting kit bag.
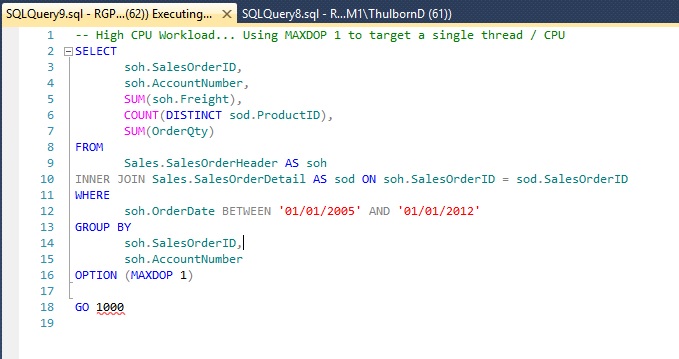
e.g…. First I create an AdventureWorks workload which hammers a single CPU due to the MAXDOP 1 setting on the query.
Now, with the “problem” at hand, I can open up Process Explorer and sort by CPU usage.
This can very quickly show me the SQL Server process is responsible for using CPU resources (which is the intention), but then right clicking on the SQL Server process and selecting “Properties” will give you a window such as this:
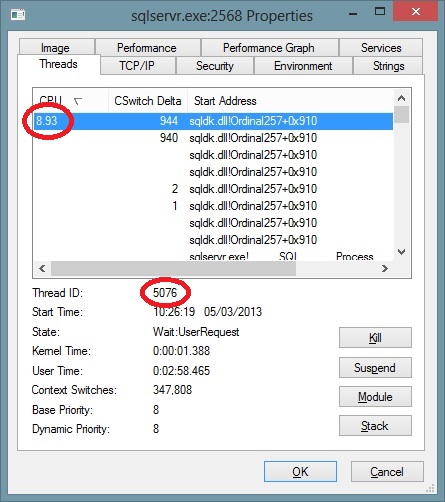
The threads tab shows you the Operating System level threads which are running within the SQL Server process, complete with the ability to sort by thread utilisation and the Thread Id which is actually running the user query.
Armed with this information, we can query SQL Server itself using:
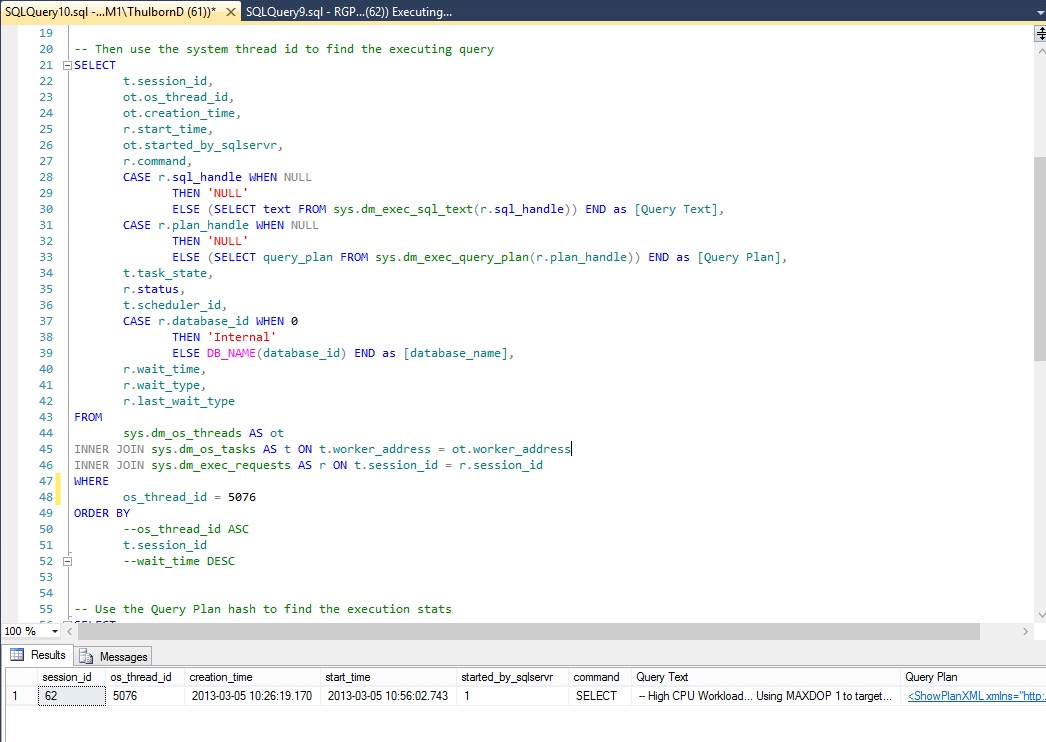
To see all the details of the query which is causing the CPU load. These details can expose everything about the query, from the actual statement, the plan, the connection details – all the usual goodness from the SQL Server DMVs. With the Process Explorer tool and SQL Server coupled in such a way, finding the full details about a hard hitting query takes less than a minute. Happy Days!..
WinDbg with SQL Server
Background:
Having been handed a broken SQL Server environment from one of our customers, I had to start some serious debugging to figure out what was causing the SQL Server process to get terminated and produce memory dumps.
Setting Up:
First off was getting WinDbg (the Microsoft Windows Debugger) up and running as described here: http://blogs.msdn.com/b/tess/archive/2005/12/05/associate-windbg-with-dmp-files.aspx
Second up, setting up the symbols I would need for the debugging session by using the symchk.exe tool to download all of the symbols for the SQL Server build in question using:
“C:\Program Files\Debugging Tools for Windows\symchk.exe” /r “C:\Program Files\Microsoft SQL Server\MSSQL11.MSSQLSERVER\MSSQL\Binn\*” /s SRV*”C:\Program Files\Debugging Tools for Windows\symbols”*http://msdl.microsoft.com/download/symbols
Finding the Problem:
So, right click and “Debug this Dump”….. Now… I’m not a hard-core developer, or a debugging expert, so I have a limited set of commands I know which help me to do the task at hand…. !analyse -v is probably one of the best, as this sets the debugger to work finding out what caused the exception. After that, a simple ‘k’ to drop out the stack at the point the exception occurred… Usually this will also list the DLL in question where the exception occurred….
My Problem:
For me, the DLL generating the exception was from a 3rd Party linked server which had been configured to run “in process” – i.e. inside the SQL Server memory space. When it hit an exception, down went SQL Server.
Solution:
SQL Server’s linked server providers have an option to run “in process” or “out of process”. This is a simple tick box within the Provider Options and controls where the DLL gets loaded as it is needed. I was able to move the provider outside of the SQL Server memory space (so no more crashes) and also tell the customer which DLL was causing the issue and who they needed to go and “have a chat” with. Happy customer 🙂

Recent Comments